Welcome to ArtifactScanTool’s documentation!
Features
Complete Integration with Brainstorm
Semi-automated exclusion of artifactual channels and epochs (i.e. trials or data blocks)
Heatmap and histogram plotting
Statical and Manual exclusions
Getting Started
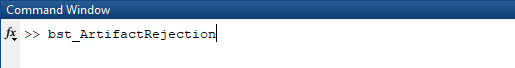
Call ArtifactScanTool (via ArtifactScanRejection)
Call the tool from the Matlab command-line
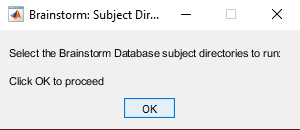
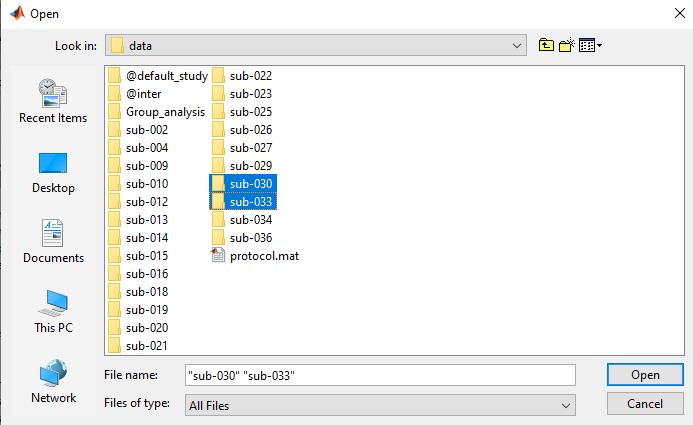
Data Input
Select the Brainstorm subject directories for review
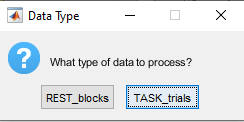
Data Type
Select the data type (typically “blocks” with resting state and “trials” for task-based data)
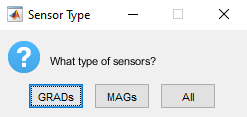
Sensor Type
Select the sensor type (designed with Elekta/MEGIN Mags Grads)
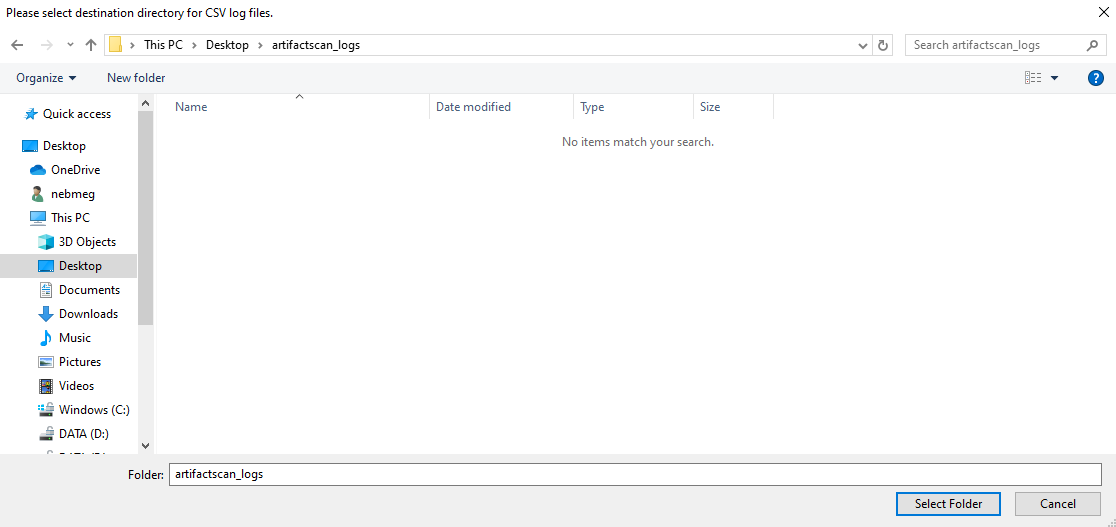
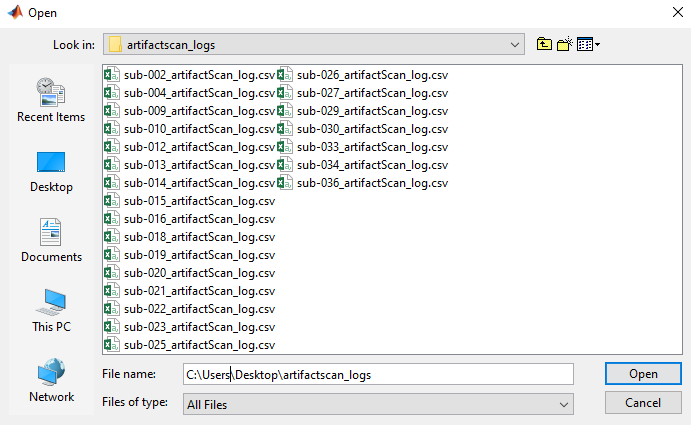
Log Output
Select output log directory path
Artifact Calculation
Data loading… Artifact measures (amplitude and gradient) will be calculated…
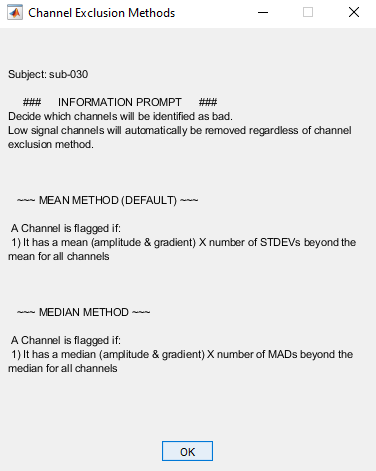
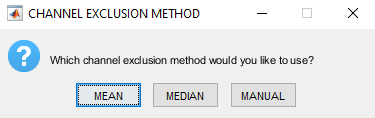
Channel Exclusion Method
Select a central tendency method to remove channels/sensors
Options
Mean
Median
Manual
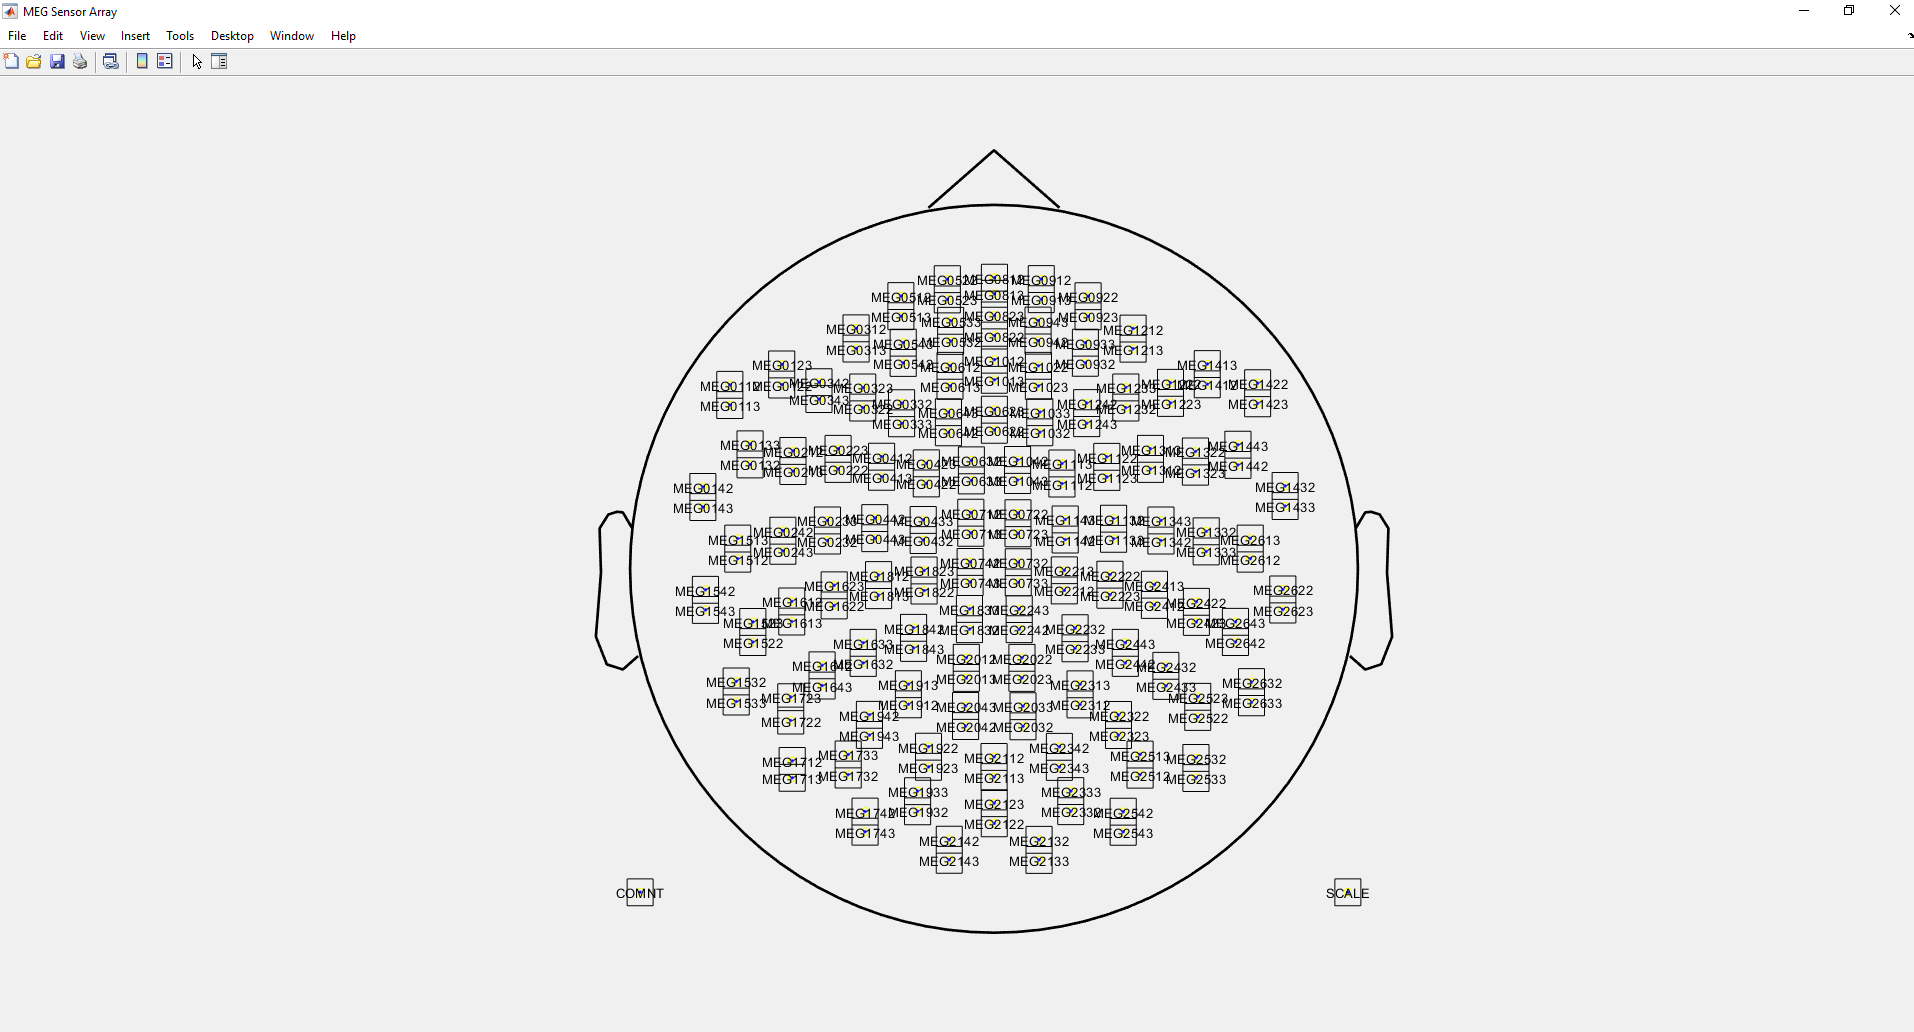
Sensor Layout
Gradiometer topoplot (with sensor labels, Elekta/MEGIN GRADS only)
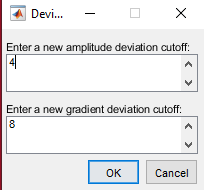
Channel Exclusion Deviation Threshold
Now enter a deviation cutoff to be applied. This will be standard deviation if “Mean” was selected, or median absolute deviation if “Median” was selected.
Channel Exlcusion Plotting
Three figures will popup; one amplitude, one gradient, and one progress report
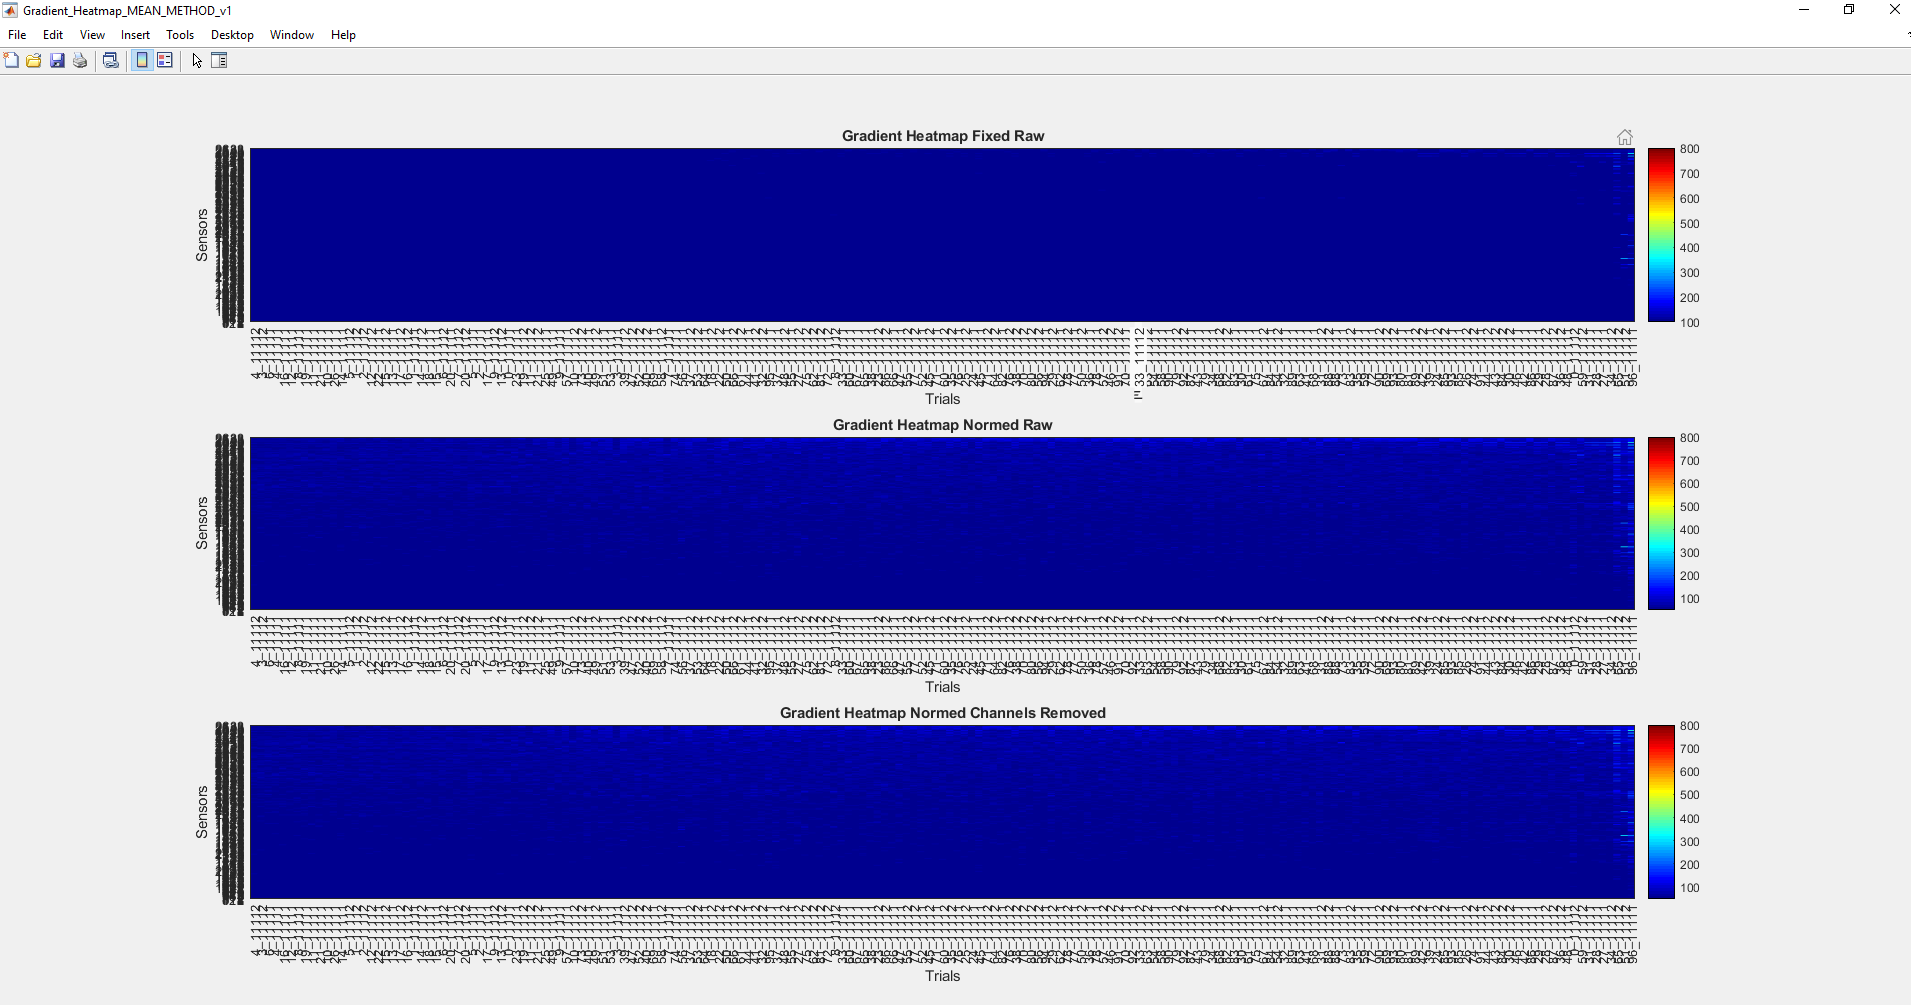
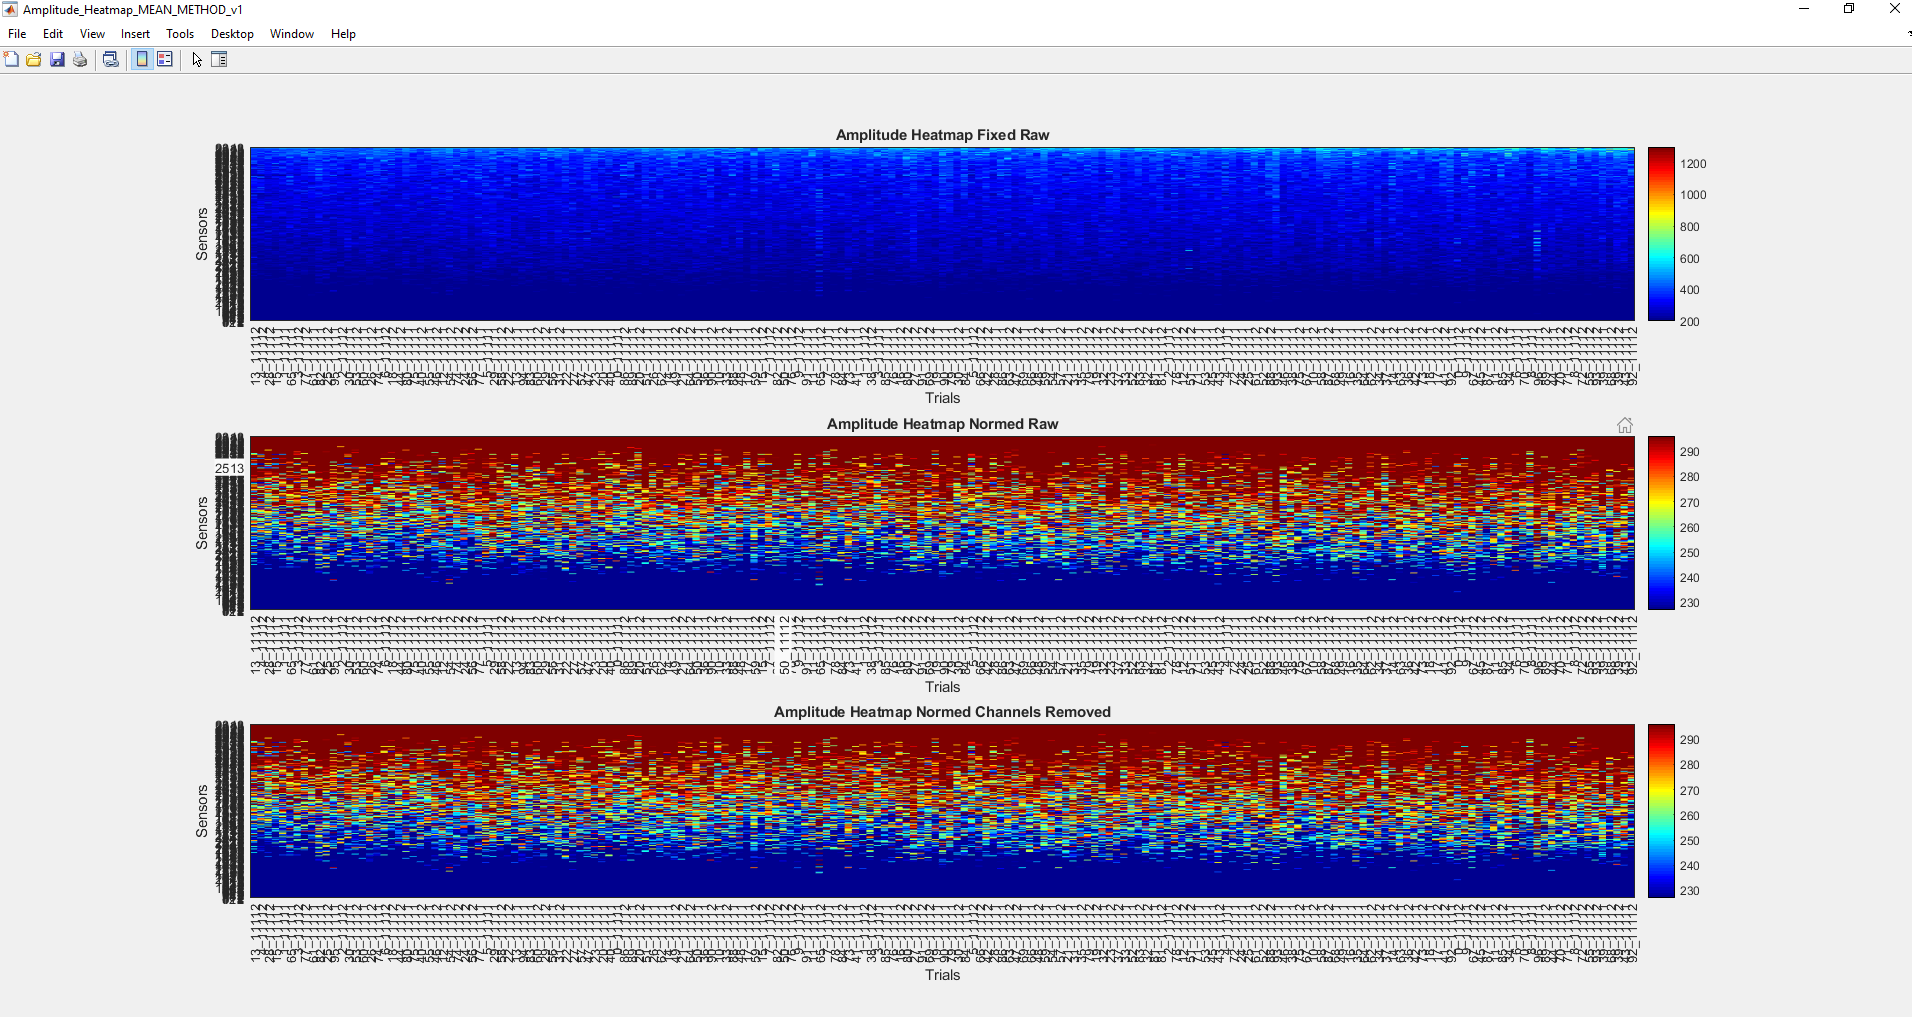
Amplitude and Gradient figures will each contain three subplots
Top subplot - fixed color thresholds, no bad channels marked
Middle subplot - color thresholds normalized to the active subject, no bad channels marked
Bottom subplot - color thresholds normalized to the activee subject, bad channels marked (with max colorbar color value)
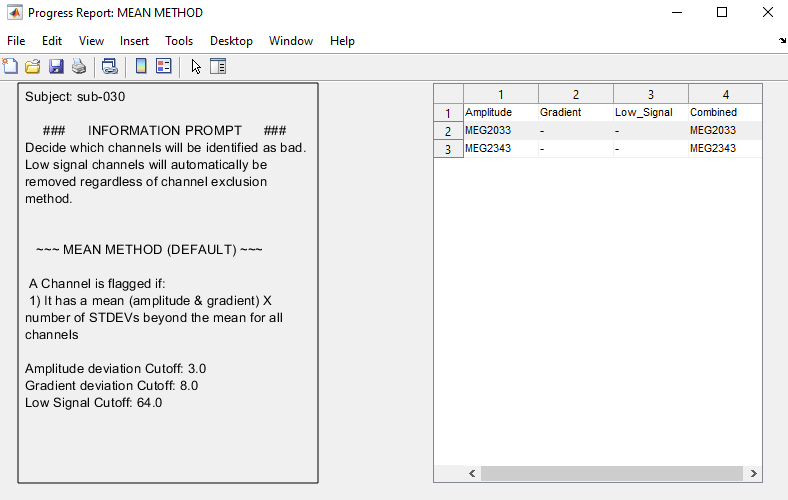
Progress Report figure will contain
The subject identifier
Which channel exclusion method was selected
Deviation cutoff values
Bad channels (i.e. tag included for amplitude, low signal, gradient)
Note - channels with a low signal 10% or more of data blocks/trials will be automatically marked for removal
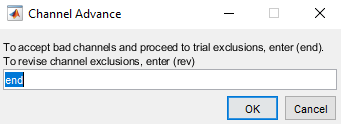
Channel Adjustment Decision
Determine whether you’d like to change channel exclusion method or adjust thresholds, or continue to trial exclusion
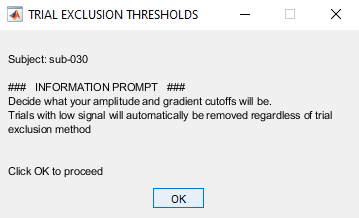
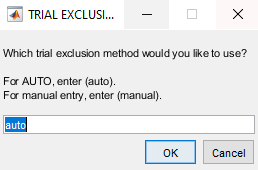
Trial Exclusion Method
You will then be prompted to select a trial rejection method to remove data blocks/trials
Options
Auto
Manual
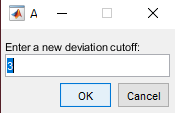
Trial Exclusion Deviation Threshold
Enter deviation value (MAD, trial exlcusion uses median for central tendency to best fit tails of distribution)
Trial Exclusion Plotting
Four figures will popup; one amplitude, one gradient, and one progress report.
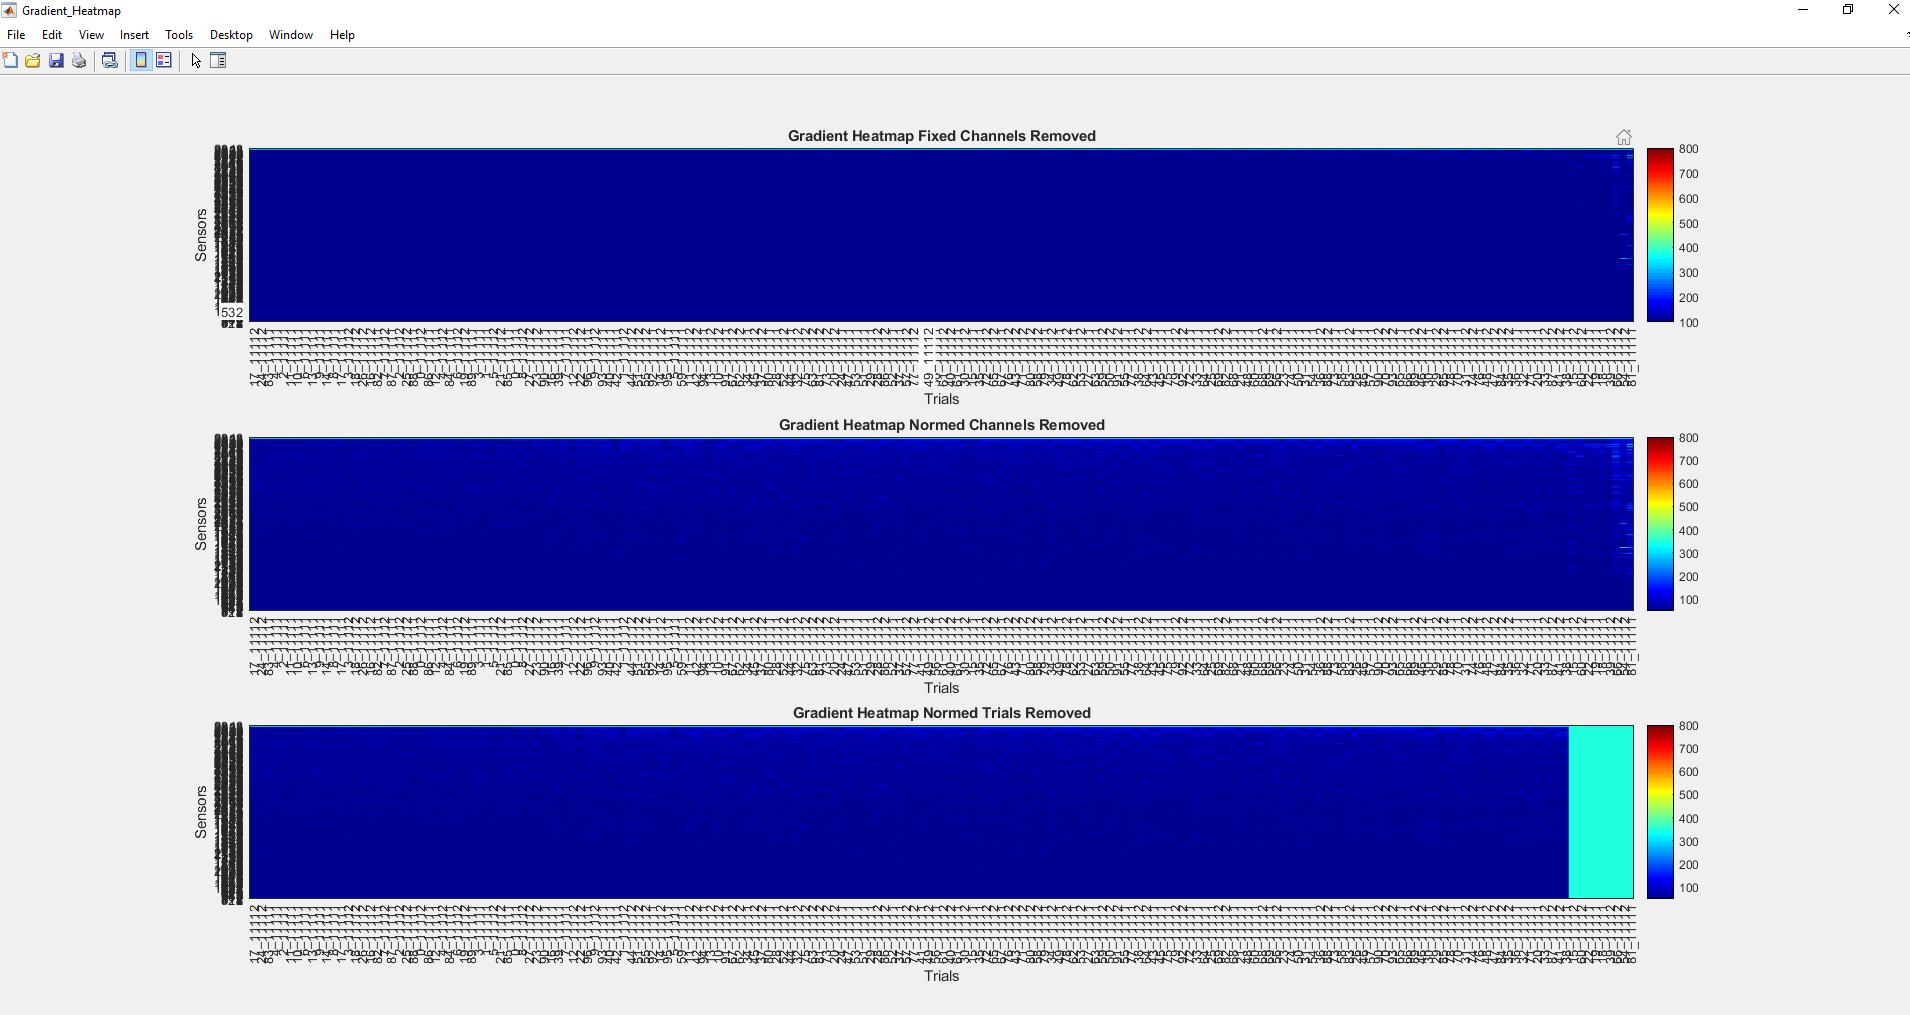
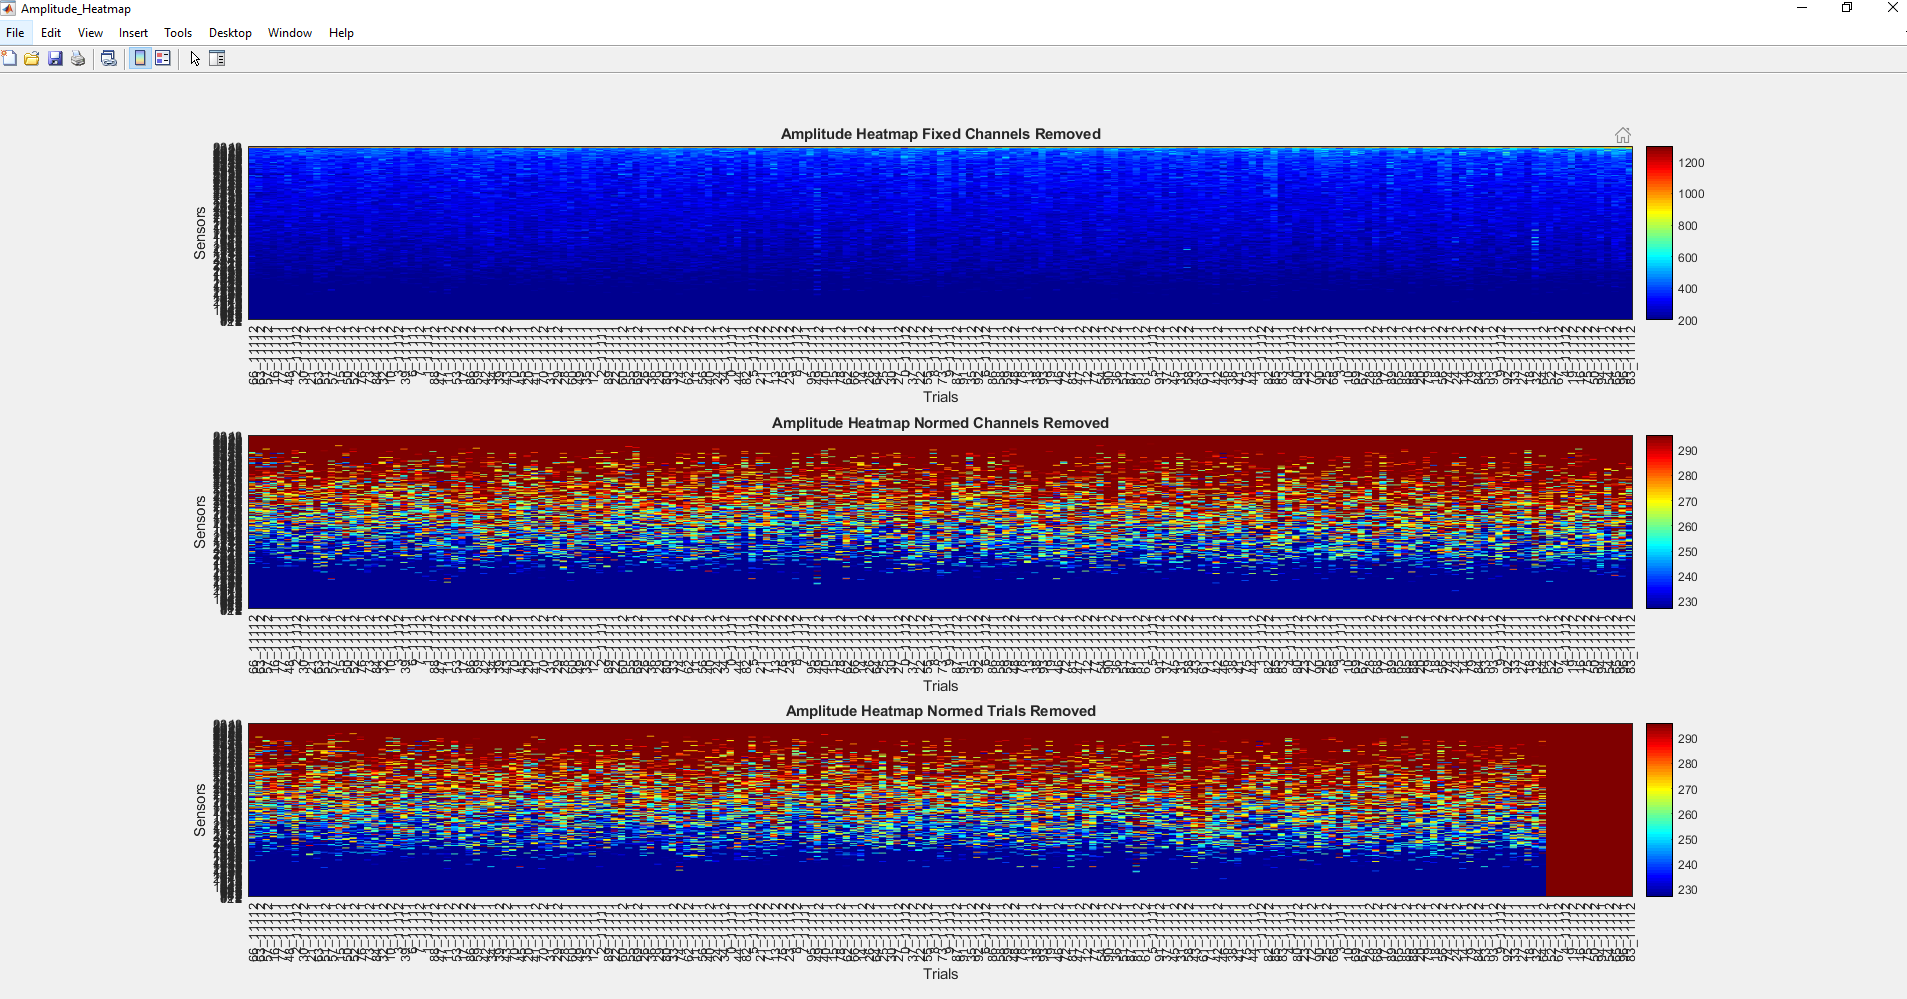
Amplitude and Gradient figures will each contain three subplots
Top subplot - fixed color thresholds, bad channels marked and no bad trials marked
Middle subplot - color thresholds normalized to the active subject, bad channels marked and no bad trials marked
Bottom subplot - color thresholds normalized to the activee subject, bad channels marked and bad trials marked (with max colorbar color value)
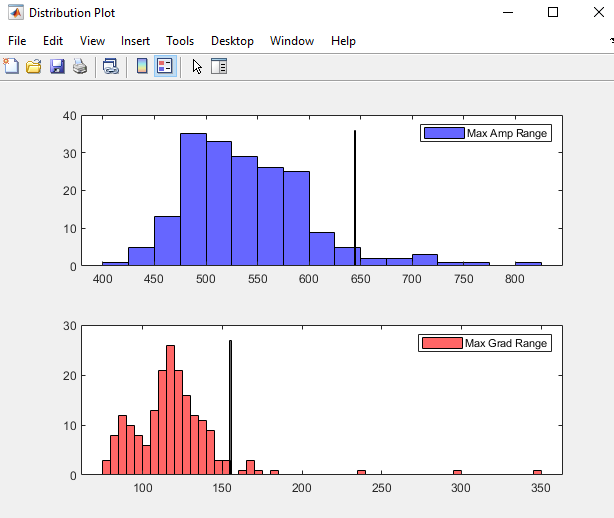
Trial distribution figure will contain
Histogram of amplitude values for each trial
Historgram of gradient values for each trial
Note - These values are estimated based on the matrix with bad channels removed (i.e. bad channel data are not included in these plots)
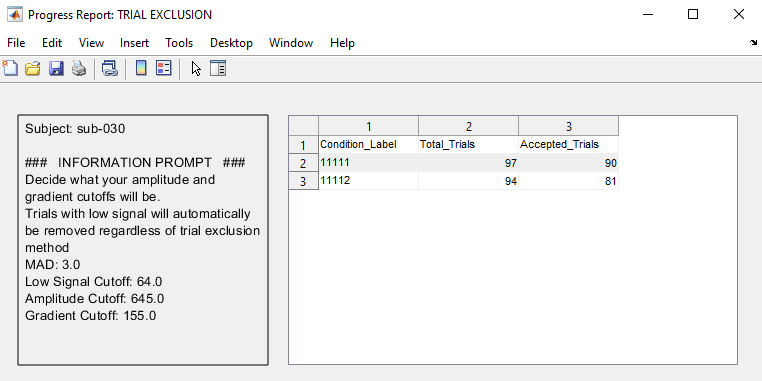
Progress Report figure will contain
The subject identifier
Deviation cutoff values
Amplitude and gradient threshold values
A table with specific counts (pre and post thresholding) for data blocks/trials. If there are multiple conditions, all will be listed
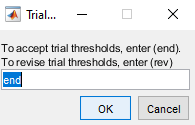
Trial Adjustment Decision & ArtifactScan Adjustment Decision
Determine whether you’d like to change trial exclusion method or adjust thresholds
Determine whether you’d like to return to the beginning and change channel exclusion method
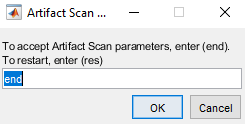
Save Results
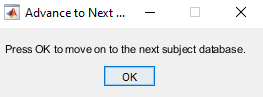
Save and proceed to next subject
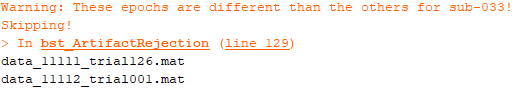
Warnings
Potential warning if data blocks/trials are of different lengths
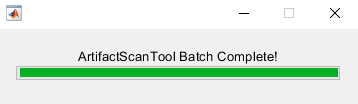
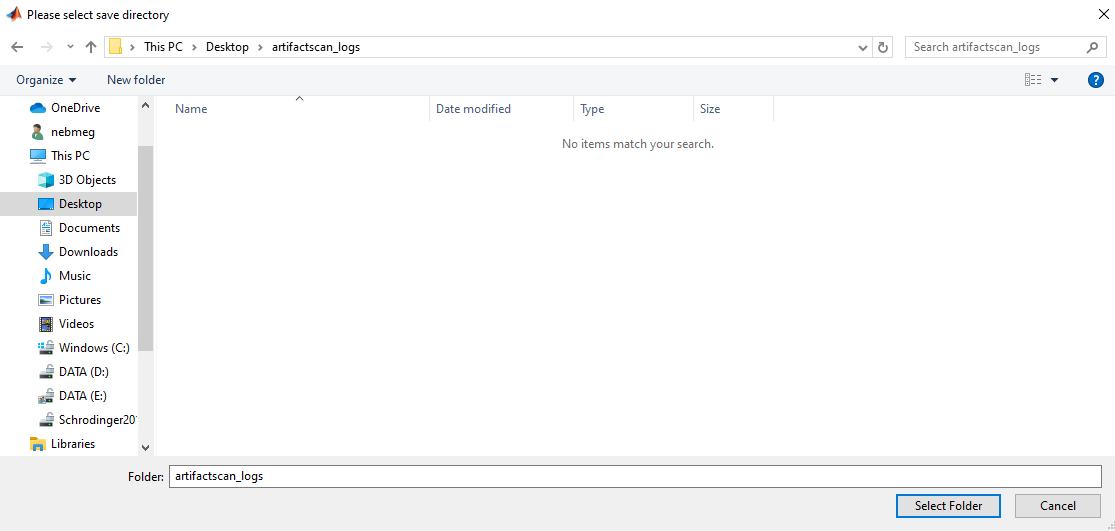
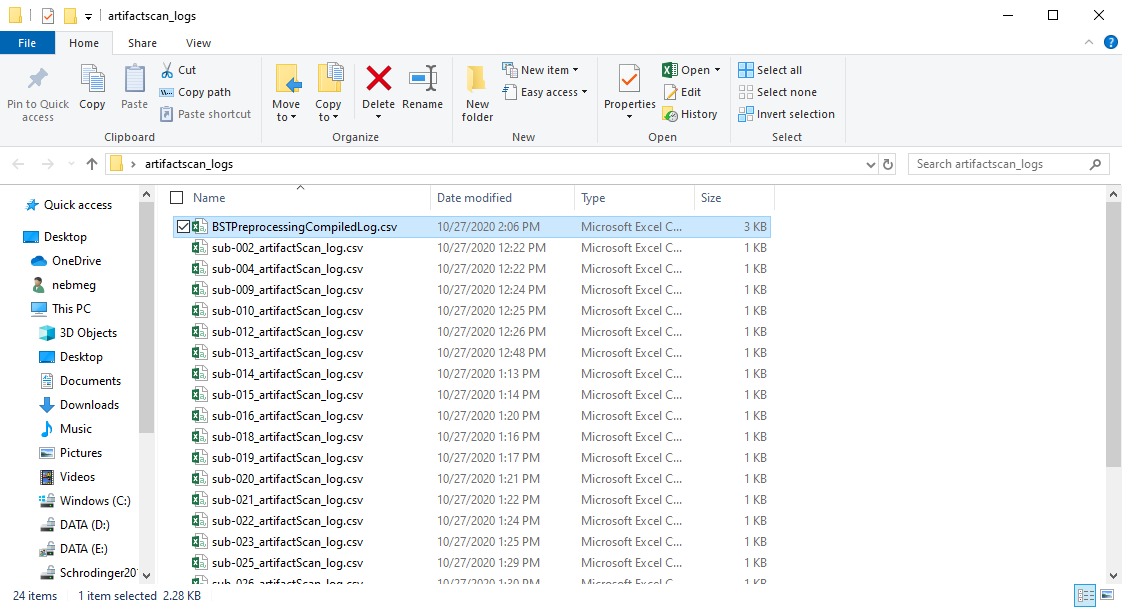
Log Compilation
Now go ahead and compile all output logs

Support
If you are having issues, please let us know. Email Nick: nichrishayes | at | gmail | dot | com
License
This software is distributed under the terms of the GNU General Public License as published by the Free Software Foundation. Further details on the GPLv3 license can be found at http://www.gnu.org/copyleft/gpl.html.